Altitude adjustments in professional match projections for baseball and basketball events
Yves Lehmann · Sep 20, 2026
Altitude adjustments in professional match projections for baseball and basketball events
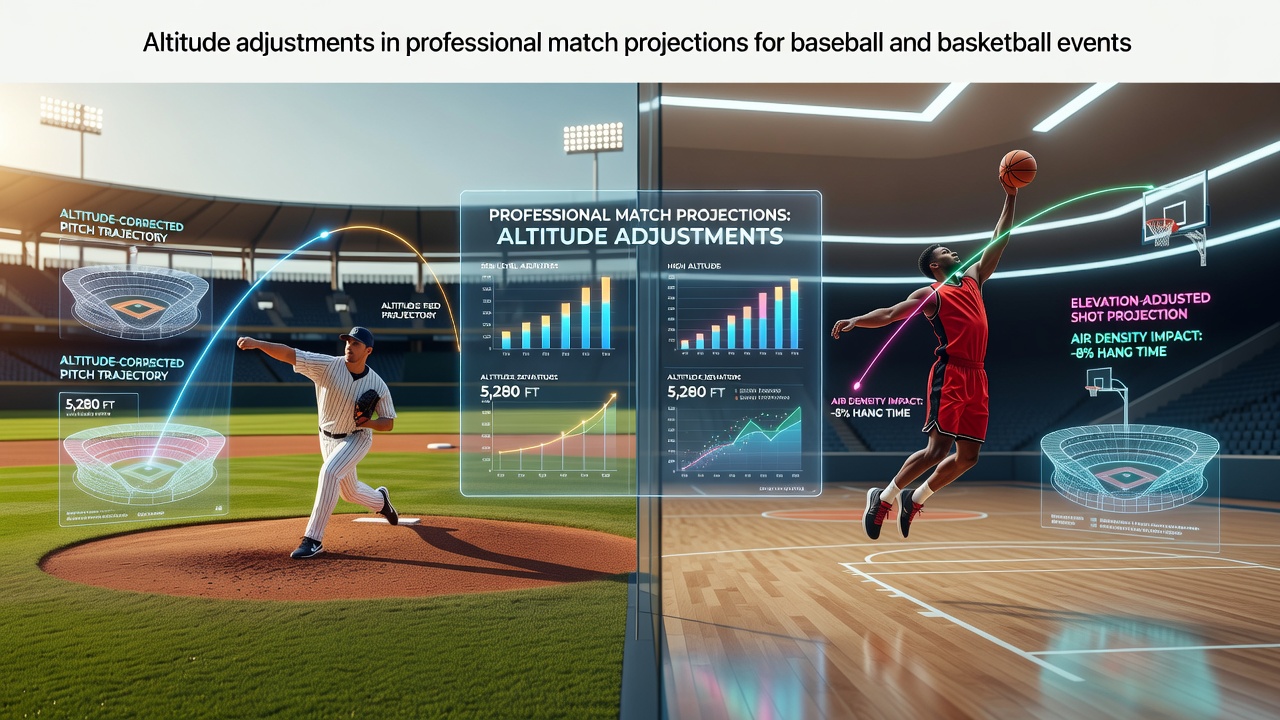
Professional sports analysts incorporate altitude data into match projections because air density directly influences ball flight, player endurance, and scoring patterns in both baseball and basketball. Teams playing at venues above 4,000 feet experience measurable changes in outcomes, and projection systems adjust run totals, point spreads, and player performance estimates accordingly. Data from multiple seasons shows that baseballs travel farther in thinner air while basketball players face increased cardiovascular demands that affect late-game efficiency.
Air density and its measurable impact on baseball trajectories
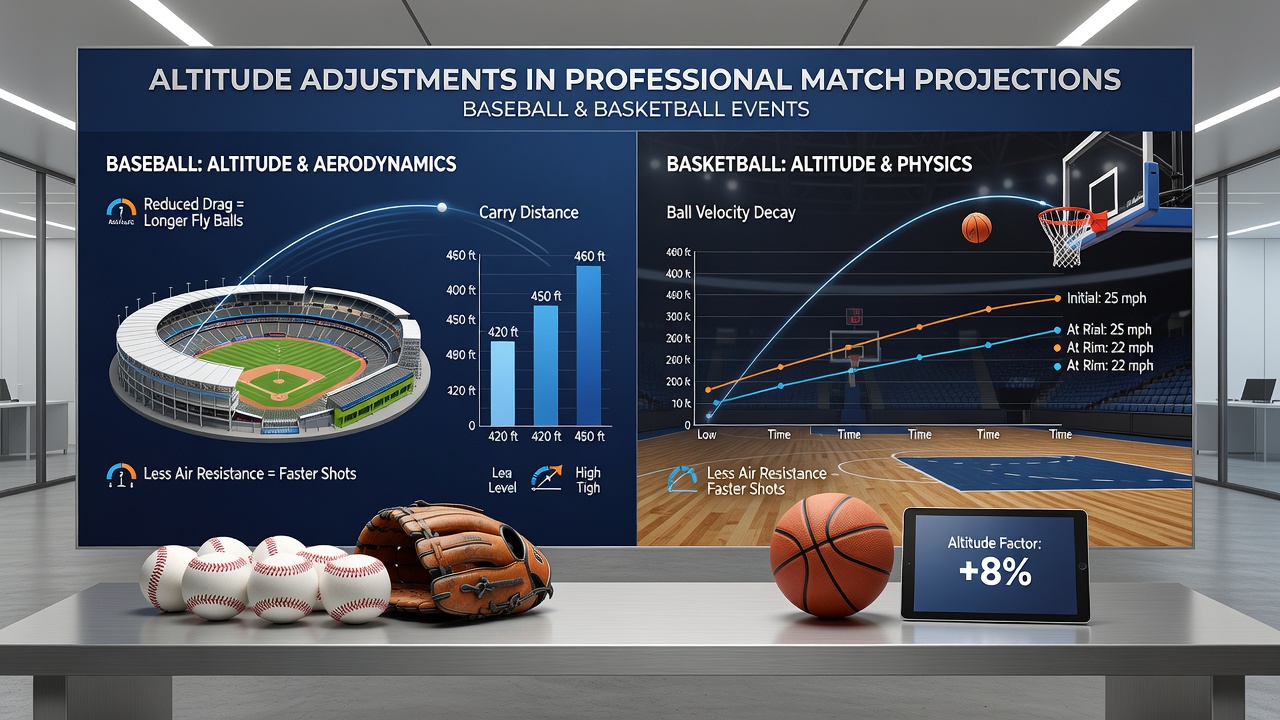
Baseball projections start with baseline statistics derived from sea-level performance, then apply altitude corrections based on barometric pressure readings collected at each stadium. At Coors Field in Denver, which sits at 5,280 feet, analysts reduce the expected number of fly balls caught and increase projected home run rates by 20 to 25 percent compared with similar lineups at lower elevations. Researchers at Colorado State University documented these patterns across multiple Rockies home games, confirming that reduced drag allows batted balls to carry an average of 20 to 30 additional feet.
Projection models also factor in temperature and humidity because those variables interact with altitude. When warm, dry air combines with high elevation, the effect compounds, and systems raise run totals by an extra half-run per game. Pitchers working in these conditions see their strikeout rates drop because breaking balls lose sharpness, so forecasters lower strikeout projections for visiting pitchers by 15 percent on average during road series in Colorado.
Basketball performance metrics at elevation
Basketball projections adjust for altitude through player tracking data that records heart rate recovery times and shooting percentages at different elevations. The Utah Jazz play home games in Salt Lake City at roughly 4,200 feet, and data indicates visiting teams score 3 to 5 fewer points in the fourth quarter when they arrive less than 24 hours before tipoff. Analysts use this information to shift point totals downward when projecting games involving rapid travel to high-altitude arenas.
Three-point shooting percentages show smaller but consistent changes. Studies tracking NBA teams across a full season found that players attempting shots above 4,000 feet convert at rates 1.8 percentage points lower than their season averages, particularly on contested attempts. Projection engines therefore apply modest downward adjustments to three-point volume and efficiency for road teams in Denver and Salt Lake City during the regular season.
Data integration methods used by projection systems
Modern projection platforms combine historical venue data with real-time weather feeds to refine outputs before each game. They pull elevation-corrected air density values from the National Oceanic and Atmospheric Administration and feed those numbers into Monte Carlo simulations that generate thousands of possible game outcomes. The resulting distributions reflect higher variance in baseball run totals at altitude and narrower point spreads in basketball when both teams are acclimated.
Teams and betting markets both rely on these adjusted figures. League-wide data released by Major League Baseball shows that home teams at Coors Field post the highest run-scoring environment in the sport, and projection models have incorporated that venue factor for more than two decades. In basketball, similar adjustments appear in conference play when Mountain West teams host visitors from lower elevations.
September 2026 schedule considerations
The 2026 MLB schedule places several interleague series at high-altitude parks during September, including multiple games in Denver and Phoenix. Projection systems begin incorporating those venue factors in late August when roster and weather data stabilize. Basketball analysts watch the same pattern during the NBA preseason, when teams conduct altitude acclimation drills before regular-season games in Salt Lake City and Denver resume.
Case examples from recent seasons
One documented series in 2024 featured the Los Angeles Dodgers at Coors Field, where pre-series projections estimated 11.2 total runs per game after altitude corrections, compared with 9.1 runs for the same matchup at Dodger Stadium. Actual scoring aligned closely with the adjusted figures. In basketball, a 2025 regular-season game between the Denver Nuggets and the Miami Heat produced a final score 7 points below the pre-adjustment projection, prompting analysts to apply stronger fourth-quarter fatigue modifiers for East Coast teams traveling to altitude.
Conclusion
Altitude adjustments remain a core component of professional match projections because elevation produces repeatable, quantifiable effects on baseball flight paths and basketball player output. Systems that integrate air density data, travel schedules, and historical venue statistics generate more accurate forecasts for both sports. As additional tracking technology becomes available, these corrections continue to refine projections across major leagues.