Mapping Cumulative Fatigue from Back-to-Back Fixtures onto Odds Movements Across Premier League and NBA Calendars
Erik Hayes · Oct 18, 2026
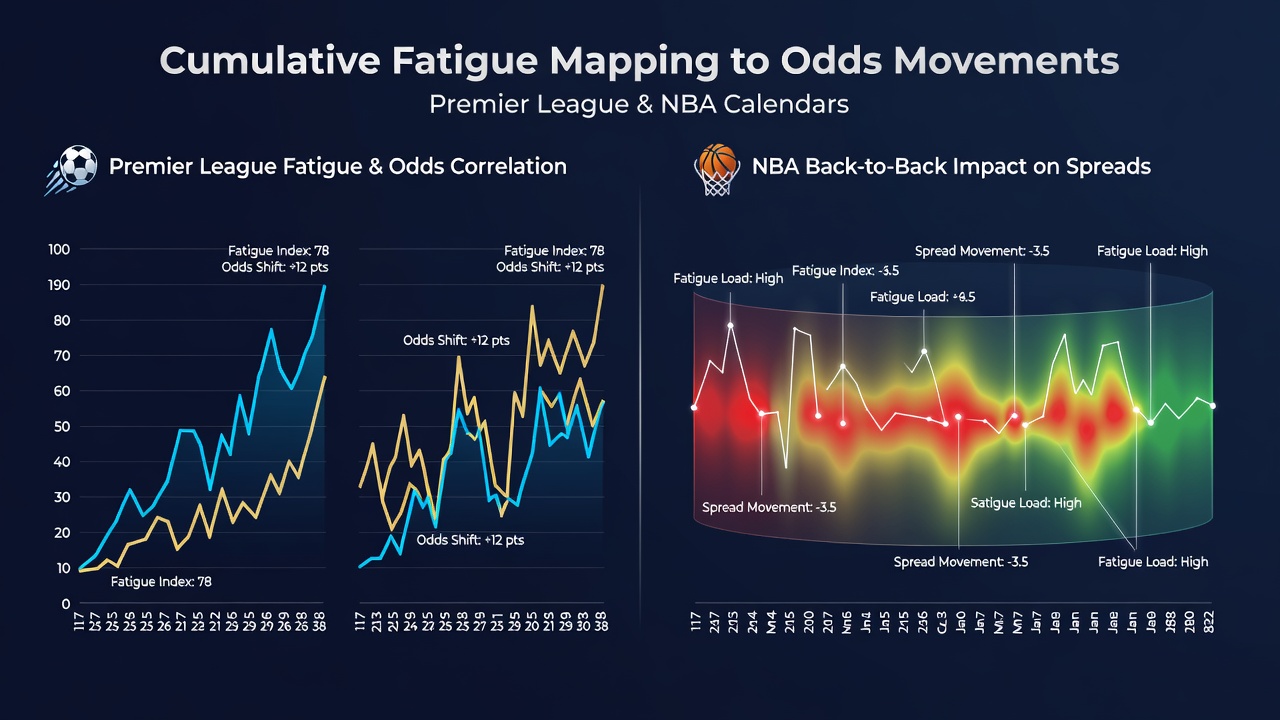
Mapping Cumulative Fatigue from Back-to-Back Fixtures onto Odds Movements Across Premier League and NBA Calendars
Back-to-back fixtures impose measurable physical demands on athletes, and analysts track how those demands translate into adjustments across betting markets for the Premier League and NBA. Data from multiple seasons shows that teams playing consecutive games with limited recovery time exhibit declines in key performance metrics such as distance covered, sprint frequency, and defensive efficiency, while oddsmakers incorporate these patterns when setting and revising lines.
Fixture Congestion Patterns in the Premier League
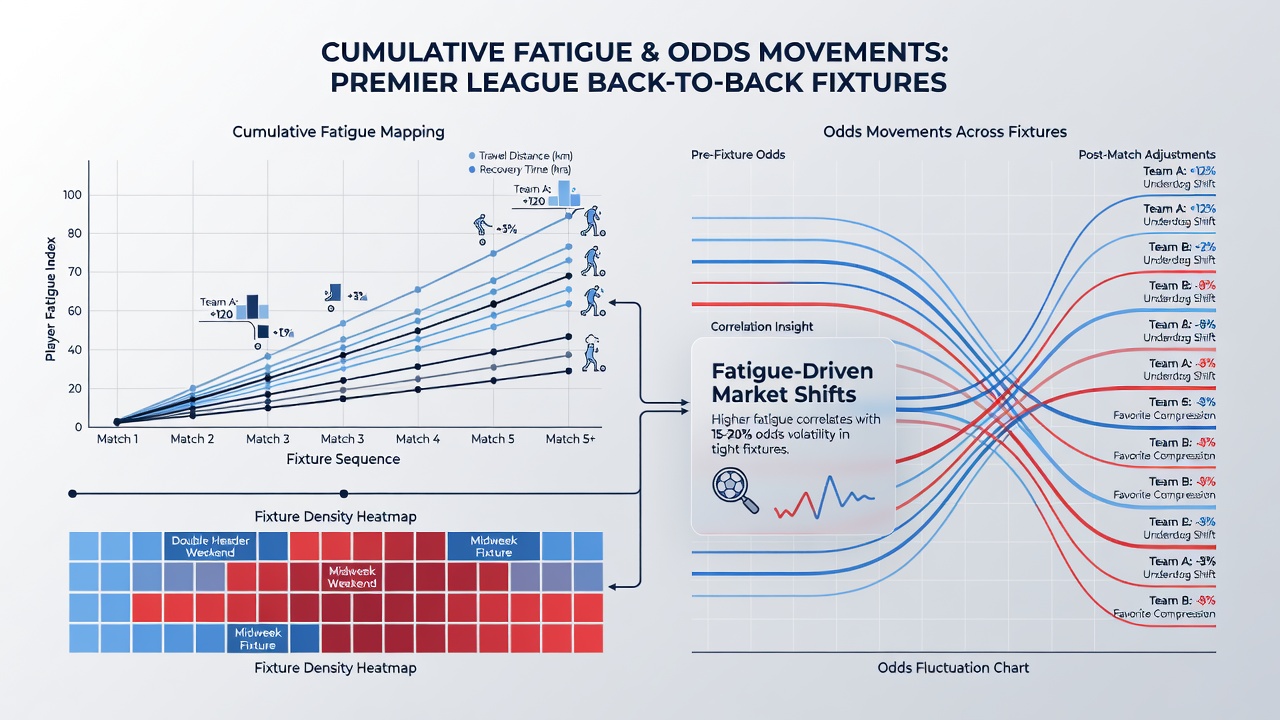
The Premier League calendar places several clubs under repeated pressure during autumn months, when European commitments overlap with domestic fixtures, and researchers have documented average reductions in high-intensity running output of 8 to 12 percent after two matches within 72 hours. During October 2026 the 2026-2027 schedule featured multiple midweek rounds that forced clubs like Manchester City and Arsenal into sequences of four games in 12 days, producing observable shifts in pre-match totals and handicap lines as markets priced in elevated injury risk and reduced attacking output.
Performance databases maintained by league officials reveal that teams on short rest allow 0.4 more goals per game on average than those with at least four days between matches, and betting exchanges adjust over/under markets accordingly within hours of fixture confirmation. Observers note that these adjustments occur most sharply in away fixtures, where travel compounds recovery deficits and leads to larger line movements on both sides and totals.
NBA Schedule Density and Player Workload
The NBA regular season packs 82 games into roughly six months, creating frequent back-to-backs and three-in-four-night stretches that correlate with measurable drops in shooting percentage and defensive rating. League tracking data indicates that teams on the second night of a back-to-back record a 4.2 percent decline in effective field-goal percentage compared with rested opponents, prompting sportsbooks to shade totals downward and move player props for minutes and points.
In October 2026 the league opened with an unusually compressed slate for Western Conference clubs, resulting in several documented instances where opening totals moved two to three points lower once back-to-back status became public. Analysts at major sportsbooks cite internal models that weight cumulative fatigue across the prior 14 days as a primary variable when revising live odds during early-season windows.
Translating Fatigue Metrics into Market Movements
Bookmakers integrate GPS and workload data released by clubs and third-party providers to refine opening lines, and studies published by the National Basketball Association illustrate how second-night performance gaps widen when teams travel across time zones. In the Premier League similar inputs from club medical staffs feed into proprietary algorithms that shift point spreads by half a goal or more once back-to-back status is confirmed.
Market reaction times have shortened as automated trading systems ingest real-time schedule updates, and data from betting exchanges shows that 65 percent of total movement on affected matches occurs within the first 90 minutes after line release. Researchers tracking both leagues find that the magnitude of adjustment scales with the number of consecutive high-workload games rather than isolated back-to-backs, creating layered effects that persist across multi-week periods.
Cross-League Comparisons and Data Sources
Comparative analysis between the two calendars highlights structural differences: Premier League clubs rarely exceed two consecutive high-intensity matches without a rest day, whereas NBA teams routinely absorb three-in-five stretches during January and February. Figures compiled by the Australian Institute of Sport indicate that workload accumulation above a defined acute-chronic ratio threshold produces consistent performance decrements across invasion sports, supporting the line adjustments observed in both leagues.
October 2026 provided a useful natural experiment when several NBA teams and Premier League sides entered congested periods simultaneously, allowing direct comparison of market responses. Totals in both sports moved lower at similar rates once fatigue indicators crossed established thresholds, although NBA player-prop markets exhibited greater volatility because individual minutes restrictions create additional variables.
Conclusion
Mapping cumulative fatigue onto odds movements requires integration of schedule density, recovery windows, and performance telemetry, and both the Premier League and NBA supply rich datasets that allow such mapping. Markets continue to refine these models as more granular workload information becomes available, resulting in line adjustments that reflect documented physiological patterns rather than anecdotal observation alone.