Tracing Real-Time Market Adjustments in Tennis, Baseball, and Rugby Union Through Performance Data
Kai Washington · Aug 19, 2026
Tracing Real-Time Market Adjustments in Tennis, Baseball, and Rugby Union Through Performance Data
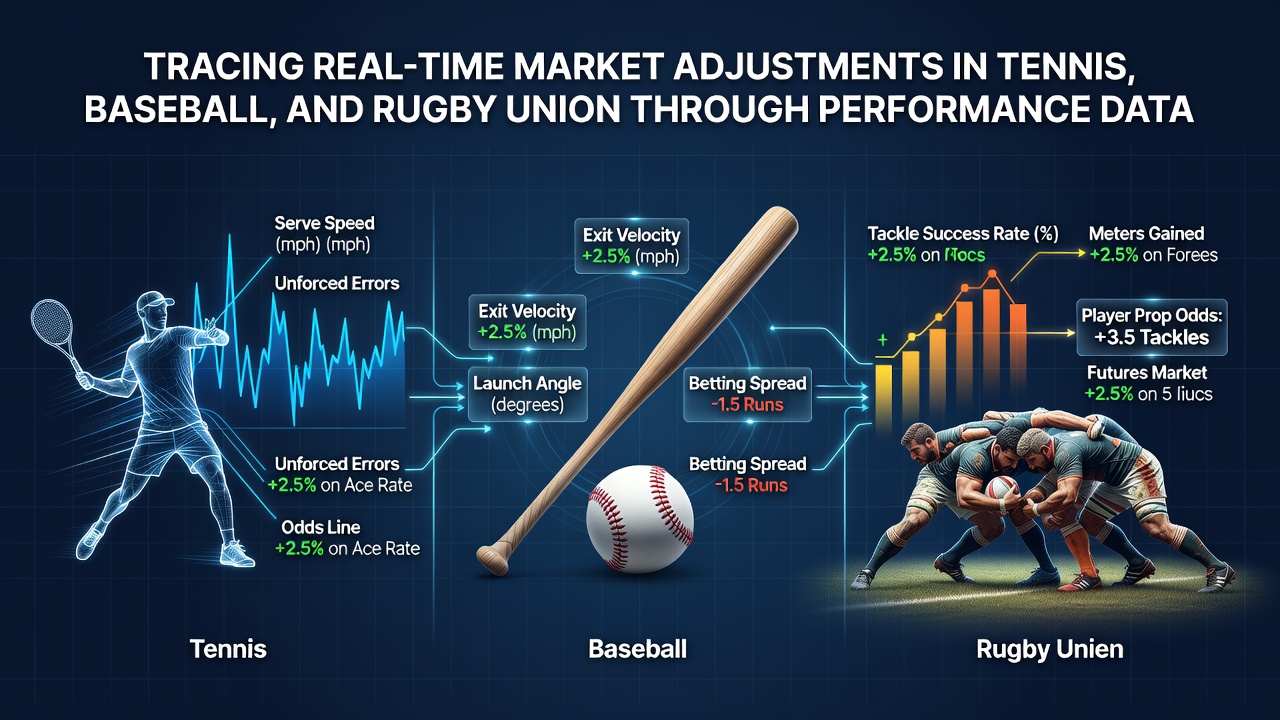
Performance data streams now shape how markets respond to unfolding events across tennis, baseball, and rugby union, with adjustments occurring in seconds rather than minutes. Sensors embedded in equipment and wearables capture ball speed, player positioning, and fatigue indicators, then feed those numbers into algorithms that recalibrate expectations. Observers note that these systems draw from both historical match archives and live inputs, allowing markets to reflect current conditions without delay. In August 2026, major tournaments and leagues continued to refine these pipelines, integrating higher-resolution tracking that records every serve, pitch, and tackle with greater precision.
Tennis: Point-by-Point Data Streams and Market Responses
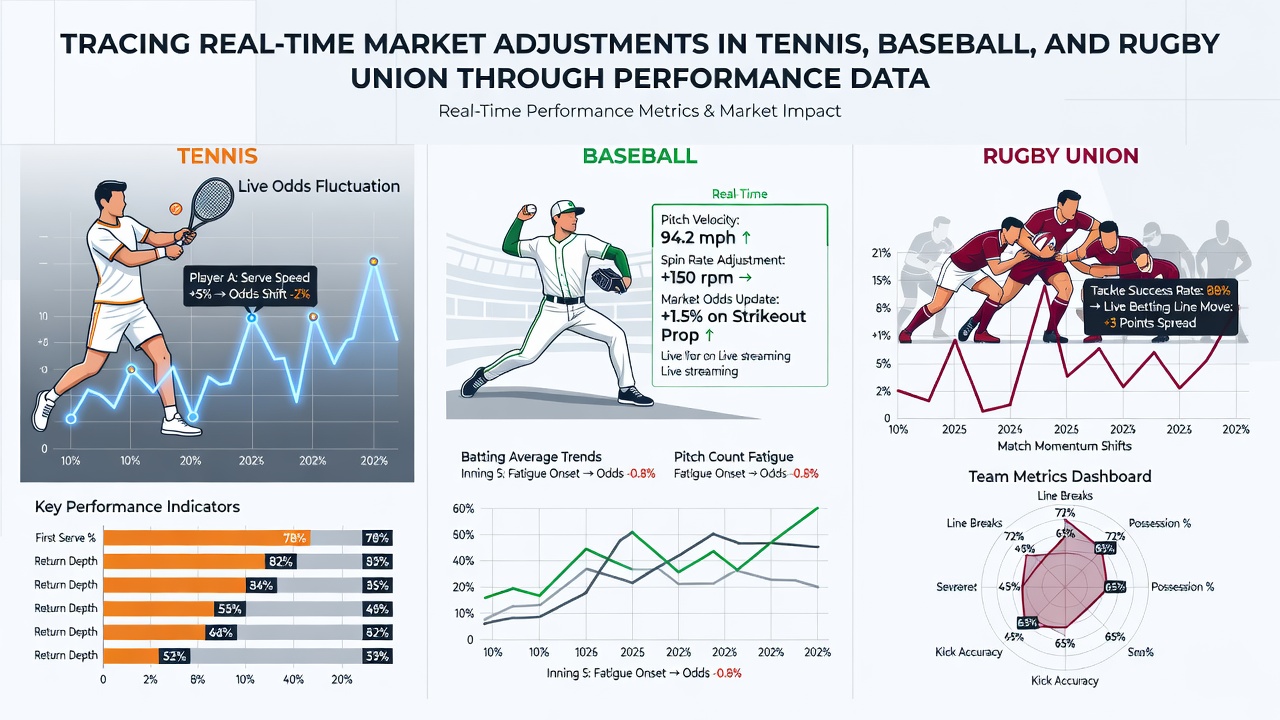
Tennis markets adjust after each point because rally length, serve velocity, and unforced error rates update probability models immediately. When a player maintains a first-serve percentage above 70 percent across multiple games, algorithms register the trend and shift implied outcomes accordingly. Researchers discovered that second-set tiebreaks produce some of the largest single-point swings, since fatigue metrics from the first set combine with real-time heart-rate data to alter projected endurance. One study from the University of Melbourne examined five years of Grand Slam matches and found that serve-speed drops of more than 4 percent after the 90-minute mark correlated with measurable market recalibrations within 15 seconds of the affected point.
Analysts also track court-surface temperature and humidity because these variables affect ball bounce and player movement. Data collected during the 2026 North American hard-court swing showed that humidity above 65 percent increased double-fault frequency by 12 percent on average, prompting markets to incorporate weather-station readings alongside player statistics. Those who monitor these feeds observe that the combination of biometric and environmental inputs creates layered adjustments rather than single-variable changes.
Baseball: Pitch-Level Analytics and Continuous Recalibration
Baseball generates granular data on every pitch, including spin rate, release point, and exit velocity, which markets incorporate almost instantly. When a starting pitcher records an average spin rate decline of 150 revolutions per minute after the fourth inning, models adjust run-expectancy calculations while the at-bat continues. Figures from Major League Baseball’s Statcast system reveal that exit velocity above 105 miles per hour on fly balls raises scoring probability by roughly 18 percent compared with league average, and markets register these outcomes within the same half-inning. In August 2026, several clubs expanded the use of high-speed cameras in minor-league venues, supplying additional data points that feed into the same adjustment engines used for major-league contests.
Defensive shifts and baserunner positioning further influence market calculations because positioning data now updates after every pitch. Studies indicate that infield alignments with three defenders on the right side of second base reduce batting average on ground balls to the left side by 0.045 points, and algorithms translate these reductions into revised win probabilities before the next batter steps into the box. The result is a sequence of small, overlapping adjustments rather than infrequent large revisions.
Rugby Union: Set-Piece and Collision Metrics in Live Markets
Rugby union markets respond to set-piece outcomes and collision data because scrums, lineouts, and tackles supply quantifiable indicators of forward dominance and defensive structure. GPS units and accelerometers measure tackle completion rates and post-contact meters gained, allowing models to update territory and possession expectations after each phase. Data collected during the 2026 international window demonstrated that teams retaining over 85 percent of their own lineout ball increased expected points per 80 minutes by 4.2 on average, with markets reflecting the shift within two phases of play. World Rugby’s global law trials introduced new sanction categories for high tackles that same year, and analysts incorporated sanction frequency into risk assessments that affect match-total projections.
Substitution patterns also generate measurable effects. When a team replaces two front-row players before the 50-minute mark, forward stability metrics typically decline by 7 to 9 percent according to aggregated match files, prompting immediate recalibration of breakdown and scrum probabilities. Those who study these patterns note that the interaction between fatigue data and replacement timing produces adjustments that accumulate across the second half rather than appearing at isolated moments.
Integration of Multi-Sport Data Platforms
Cross-sport platforms now combine performance feeds from tennis, baseball, and rugby union into unified dashboards used by analysts and trading desks. These systems apply common statistical frameworks while preserving sport-specific variables such as rally length in tennis or scrum success rates in rugby. According to a 2025 report issued by Statistics Canada on sports-technology adoption, organizations that merged live tracking with historical datasets reduced latency between event and market update from 45 seconds to under 12 seconds across monitored competitions. The same report highlighted that Canadian and Australian research institutions contributed parallel studies on collision and endurance metrics, supplying comparable benchmarks for rugby and baseball respectively.
Regulatory bodies in different jurisdictions have begun reviewing how such data pipelines affect market transparency. The Australian Competition and Consumer Commission published guidelines in early 2026 that require disclosure of automated adjustment triggers when performance data directly influences pricing mechanisms. Observers report that similar discussions continue in the European Union, where data-protection rules intersect with real-time analytics requirements. These developments illustrate how performance data now sits at the center of both sporting analysis and market operations.
Conclusion
Real-time performance data has become the primary driver of market adjustments in tennis, baseball, adn rugby union. Point-level metrics in tennis, pitch-by-pitch analytics in baseball, adn phase-specific measurements in rugby union each produce distinct but comparable adjustment patterns. As tracking technology improves and regulatory frameworks evolve, the interval between on-field event and market response continues to shorten. The patterns observed through August 2026 indicate that multi-layered data integration will remain the central mechanism for translating athletic performance into updated market positions across these sports.